The trade screen is where you place trades into the market. You can automatically apply trade settings such as offset bets, offset bets with built-in profit. And with stop loss settings if you choose.
Fill and Kill settings are also available.
You can also reverse the table so that you can place back trades at the current lay price and vice-versa. This is a great way to get your trade off to a good start. Use fill/kill to implement the trade if the market moves away and stop loss settings to prevent unintended losses.

In the above image you can see all the selections in a market. The three market leaders, favourite, 2nd favourite and 3rd favourite are highlighted with a green background. The order of the market is as set by Betfair.
Over on the left you will see the selection name. The figures below are the profit should that selection win. The figure in brackets is the profit should you close the trade at the current price.
If viewing a supported horse race, which is most of those in the UK, Aus and USA you may see more data useful to a trader such as form, weight, stall number, days since the horse last ran (layoff) and the age of the horse.

The GREEN figures are the profit should that selection win. The number in brackets is the green-up figure on that selection alone.
These numbers are RED should the figure show a loss.
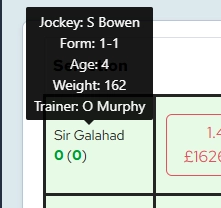
If this is a horse race, you can hover the mouse pointer over the selection name and you will see more details if available such as jockey, horse age, weight, form and trainer. Note, not all of these details are supplied with every horse race.

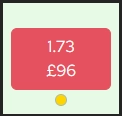
To place a trade into the market you are looking at, click on one of the boxes with an available price. If the box is blue, you will place a back bet. If the box is pink, you will place a lay bet. You can reverse the trade screen by clicking on ‘Reverse’ in the ‘Trade Settings Area’.
If ‘Reverse’ is switched on, this means the blue and pink areas will swap. When you now click on a blue box, you will still place a back bet but now it will be at the lay prices. Clicking on a pink box will place a lay bet at the current back prices. These will not immeadiately be matched (unless the market is volatile) but getting a reversed bet matched will give you a small edge.

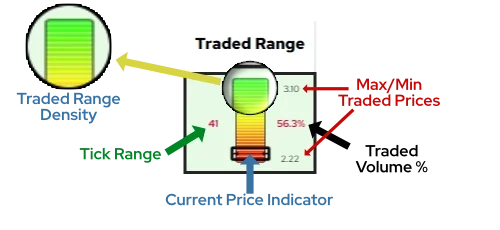
At the far right of this area is the traded range widget. This contains a wealth of information at a glance and will be invaluable in your trading. Let’s take a look.

Let’s start with the number on the left. In this case, 41. This represents the number of Betfair price ticks between the lowest traded price and the highest traded price. Don’t worry about outliers or an anomolous number as anything below a particular volume is discounted.
The grey figures to the right are the actual prices at the bottom and top of the traded range. In this example we can see the top price was 3.10 and the lowest price was 2.22.
You will notice the vertical bar with a coloured gradient from red to yellow to green has horizontal white lines. The number of these lines is related to the traded range. The more lines you see, the greater the traded range. This is a visual clue to what has happened to the price of this particular selection.
You will then notice the black, rectangular indicator on the vertical bar. This is giving a visual clue as to where the CURRENT PRICE is in relation to the traded range. In this particular example, the current price must be close to the bottom of the traded range.
If we look at the top image we can from the chart and the current indicator that the price was heading to the lower value at that time.
The figure of 56.3% represents the amount of money as a percentage of the market total that has been traded on this selection. This gives a great indication of how where the money is going in this market with over half the total volume on one single selection in this case.